Financial Health at a Glance
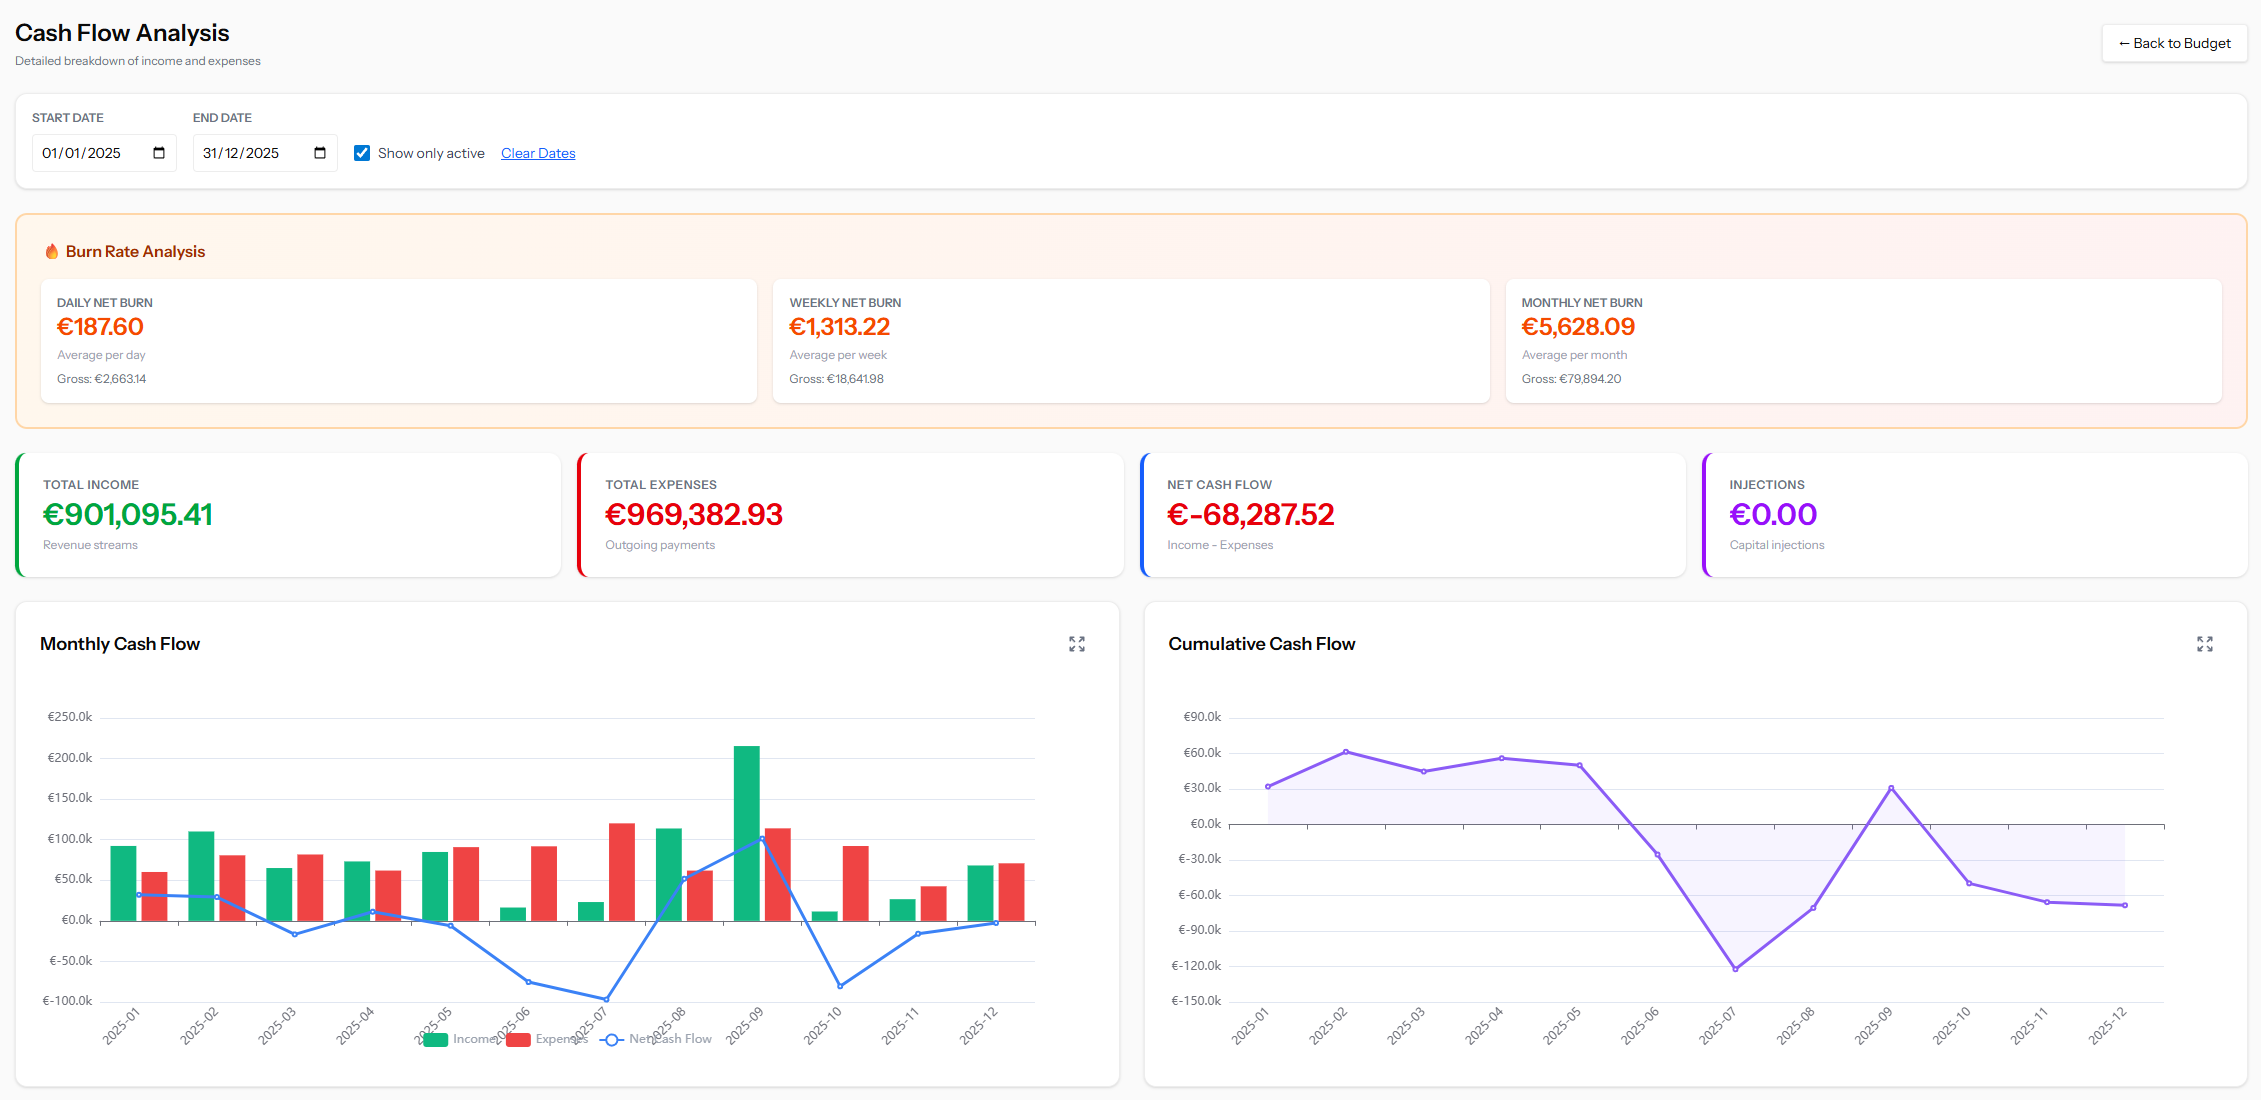
Burn Rate & Runway
The page automatically calculates your burn rate based on expense patterns, giving you a clear answer to the most critical question for any business: how long can you sustain current operations? This metric updates in real time as your budget data changes.
Income & Expense Composition
Rather than treating all revenue or spending as a single number, the page breaks down both by category. This helps you understand which revenue streams are strongest, which cost categories dominate, and how these proportions shift over time.
Summary Metrics
Computed income, expense, and net cash flow totals displayed at a glance, providing an always-current financial health indicator.
Strategic Insights
Product vs. Project Analysis
For businesses that balance recurring product revenue with project-based income, this breakdown is essential. It reveals the mix between stable, predictable income and variable project work — helping you gauge financial stability and allocate resources accordingly.
Trend & Seasonality Detection
Monthly and cumulative cash flow views make it easy to spot seasonal patterns, growth trends, or emerging cash crunches. By seeing inflow and outflow side by side over extended periods, you can identify months that historically run tight and plan ahead.
Year-over-Year Comparison
Select multiple years to overlay and compare financial performance across periods. This is particularly valuable for tracking growth, measuring the impact of strategic decisions, and validating whether operational changes are producing the expected results.
Top Movers
Ranked tables of the largest income sources and expense items surface the transactions that matter most. Combined with expandable category drill-downs, this lets you quickly trace a high-level concern down to its root cause.
Analytics
Date Range & Active-Only Filter
Restrict all analysis to a specific period and optionally include only active transactions.
Fullscreen Panels
Every chart and table can be expanded to fullscreen for presentations or deeper inspection.
Persistent Preferences
View settings (date ranges, selected comparison years) are saved to the backend so your preferred view is always ready.
Ready to simplify your workflow?
Cash Flow is just one of many tools in the Simplify Suite. See how they all work together.